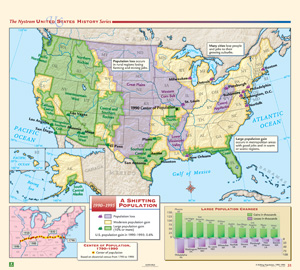
A SHIFTING POPULATION, 1990–1995
Map on spring roller with backboard
Connect with a representative to create a custom curriculum for your district.
Color shading shows areas that lost population, areas that had a moderate population gain, and areas that had a major population gain (10% or more). One inset at the bottom shows the gradual movement westward of the nation’s center of population from 1790-1990; the other has a bar chart comparing cities that had the greatest population gains versus those with the greatest losses.
This title is part of the series: THE NYSTROM COMPLETE U.S. HISTORY MAP SET

